As anyone peering into a microscope can attest, eukaryotic cells contain a rich landscape of visual features and landmarks whose complex dynamics nearly defy human comprehension.
Could a deep learning AI work with microscopic images to understand a cell’s physiological state? Would the AI be able to learn defined cell markers or identify new markers based on features or patterns not easily observable by the human eye? The advent of machine learning involving deep neural networks has the potential to change how biologists analyze cell complexity. Only limited examples have been shown to date, but a new study published in the journal Molecular Biology of the Cell opens new possibilities in cellular optical analysis.
A research team at The University of Tokyo Graduate School of Science and International Research Center for Neurointelligence (IRCN) led by Daisuke Takao and Yasushi Okada investigated the historical problem of cell cycle classification analysis using deep neural networks and computational analyses. The cell cycle is the backbone of animal and organ development and regeneration. Based on cyclical phases of DNA replication and synthesis G1/S, quiescence G2, and mitotic division M, the cycle had conventionally been defined by fluorescence-based molecular markers for each phase. The researchers sought to test the idea that changes in cell biological features such as the nucleus, Golgi apparatus, and cytoskeleton tracked by a neural network trained on large numbers of cells can classify the cell cycle.
The researchers constructed convolutional neural networks (CNNs) known to be effective for cell biological classification, and trained them with data from cells labeled with Hoechst (DNA), GM130 (Golgi) and EB1 (microtubule plus ends), targeting cell features that were known or presumed to show dynamic changes across the cell cycle. They demonstrated that their CNNs could extract known cell features to classify the cell cycle phases of G1/S or G2. Combinations of features were even more effective at classification. A further morphological analysis called Grad-CAM allowed them to identify the pairs of features that were effective in classification. The size and shape of the nucleus, for example, were identifiable classifiers.
The results demonstrate that CNN models will become increasingly powerful classification tool for biological imaging. In addition, they can also provide guidance on what cell features may be interesting or important to focus on. While the study used fixed cells, the application to live cell imaging will be feasible. Further refinement of AI algorithms in the classification of cell structure and dynamics with biological explainability may provide new insights in cell and developmental biology and enhance medical and pharmaceutical diagnostic applications.
Correspondent: Charles Yokoyama, Ph.D., IRCN Science Writing Core
Reference: Nagao, Y., Sakamoto, M., Chinen, T., Okada, Y., and Takao, D., (2020) Robust Classification of Cell Cycle Phase and Biological Feature Extraction by Image-Based Deep Learning, Mol Biol Cell DOI: 10.1091/mbc.E20-03-0187
Media Contact: The author is available for interviews in English.
Professor Yasushi Okada, M.D., Ph.D.
Graduate School of Science
International Research Center for Neurointelligence (IRCN)
The University of Tokyo
Assistant Professor Daisuke Takao, Ph.D.
Graduate School of Medicine
International Research Center for Neurointelligence (IRCN)
The University of Tokyo
Mayuki Satake
Public Relations
International Research Center for Neurointelligence (IRCN)
The University of Tokyo Institutes for Advanced Study
pr@ircn.jp
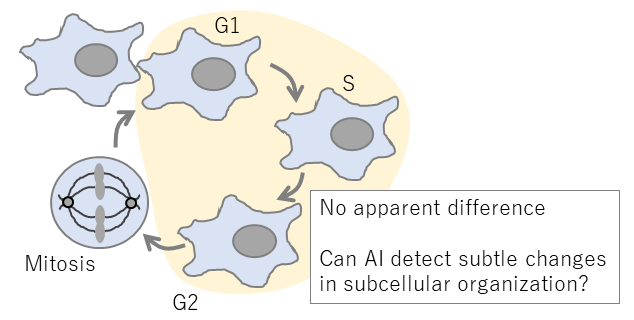
Fig 1. Cell cycle and changes in subcellular organization.
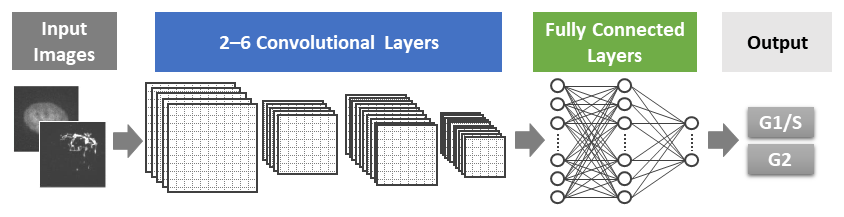
Fig 2. Schematic of the AI model developed in this study.
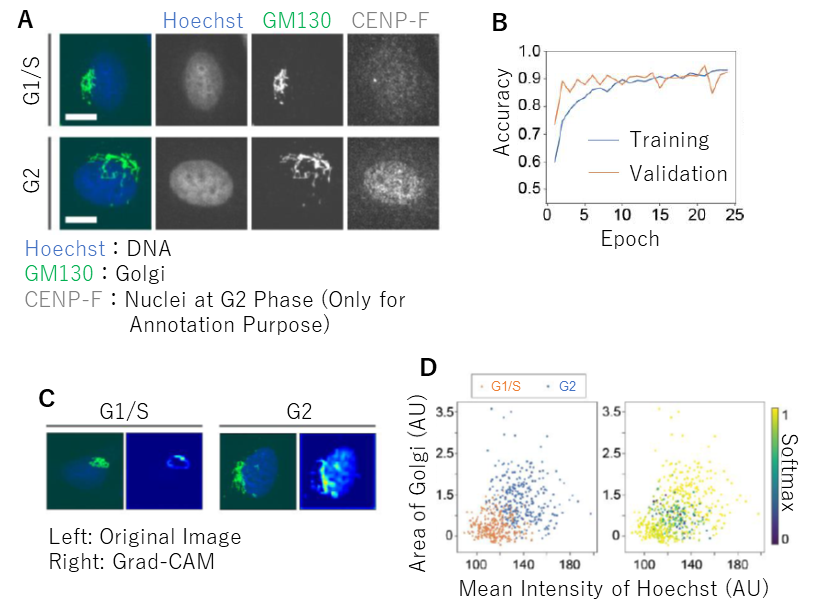
Fig 3. Classification of cell cycle phases and feature extraction. (A) Representative images of cells stained for DNA and Golgi. Note that the AI did not see the nuclear images. (B) A learning curve achieving 91% accuracy. (C) Grad-CAM analysis to visualize the region that the AI focused on. (D) Two-dimensional plot of two selected parameters measured in original images. Plots are color-coded according to cell cycle phases (left) and Softmax values (right).